What is a Story?
A Story is a sequence of pages, visualizations, and commentary, to share specific insights from your data. Create a Story to share a compelling narrative, underlying context, relate decisions to outcomes, and more. Basis your user persona you can access different features of Stories. For example, an author can create an exploration with multiple pages and visualizations and build a Story that highlights anomalies, trends, business KPIs etc. Whereas an App user and reader can navigate or present a Story already created by the author.
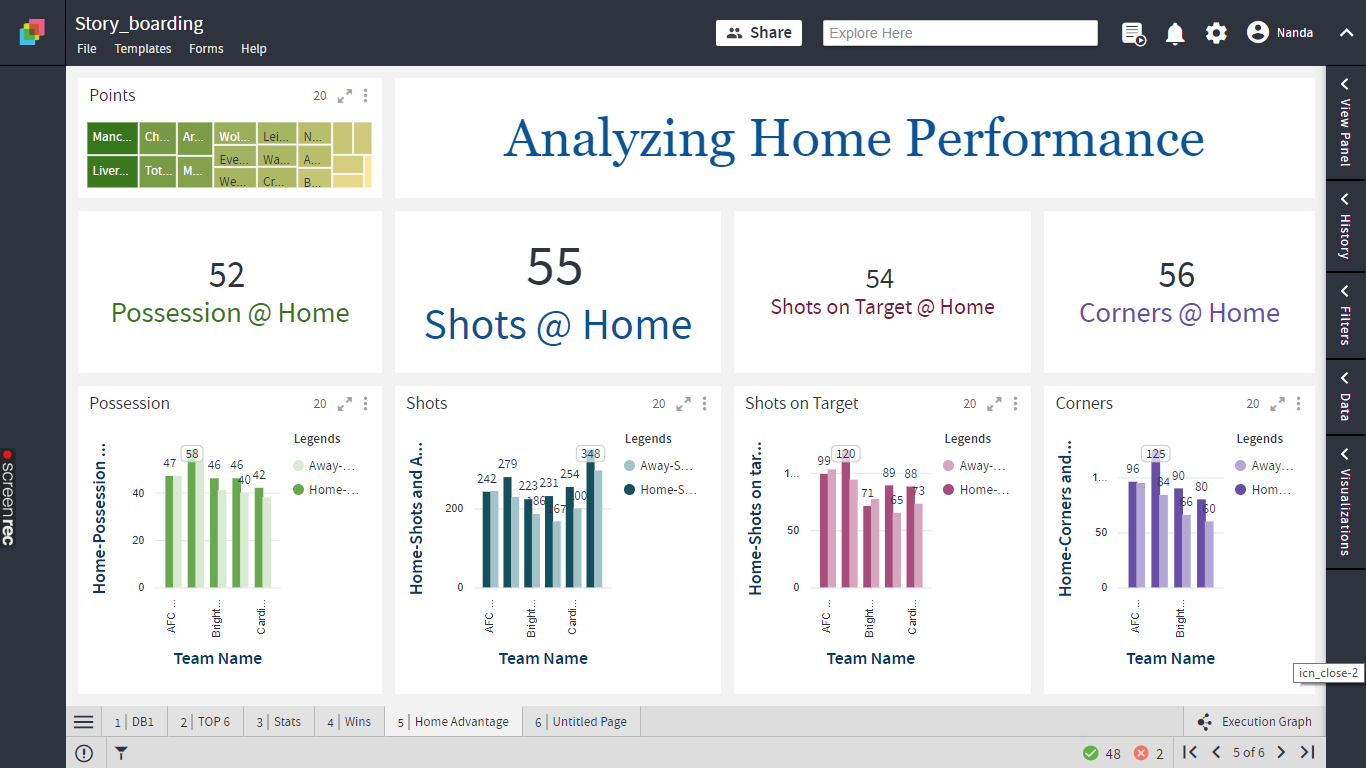
The following Story explains the analysis of home ground wins in English Premier League and if home advantage converts into tangible results in the game. It also shares the outlier.

Plan a Story
It is important to plan the purpose of a Story.
You may want to:
- Share observations or show comparisons
- Draw attention to an anomaly or outlier
- Identify what needs attention or immediate action
- Inform about the status of work
Once the purpose is defined, start building the Story around the data and visualizations in your exploration. You may also add new visualizations, as required.
Build a Story
Once you've created the framework, start building your Story with Story Points.
A Story Point is a snapshot of a page of your exploration. The snapshot records visualizations, user selections, and the corresponding highlighting and filtering. You may create a Story Point with no selection on the page.
You may add commentary to a Story Point. When you present a Story, the title of Story Point is shown in the header and its description in the footer.
 Note: Story Points present the user selections and visualizations on a page with the latest data. Note: Story Points present the user selections and visualizations on a page with the latest data. |
To illustrate the Story-building process, refer to the exploration below to analyze data of the English Premier League(EPL). The goal of the Story is to present the advantage, if any, of playing at home in EPL.
| Note: Only “Authors” can build a Story. |
Create Story Points
You can create Story Points in two ways-
- Page with Data Selection
- Page without Data Selection
Page with Data Selection
- According to your Story plan, select the data elements on the page. Data in other visualizations may get highlighted/filtered.
Note: Hold Ctrl Key to select multiple data elements. - A menu will pop up next to the mouse pointer, Click on
 icon to create a Story Point (See image below). The Story Point will memorize your selections.
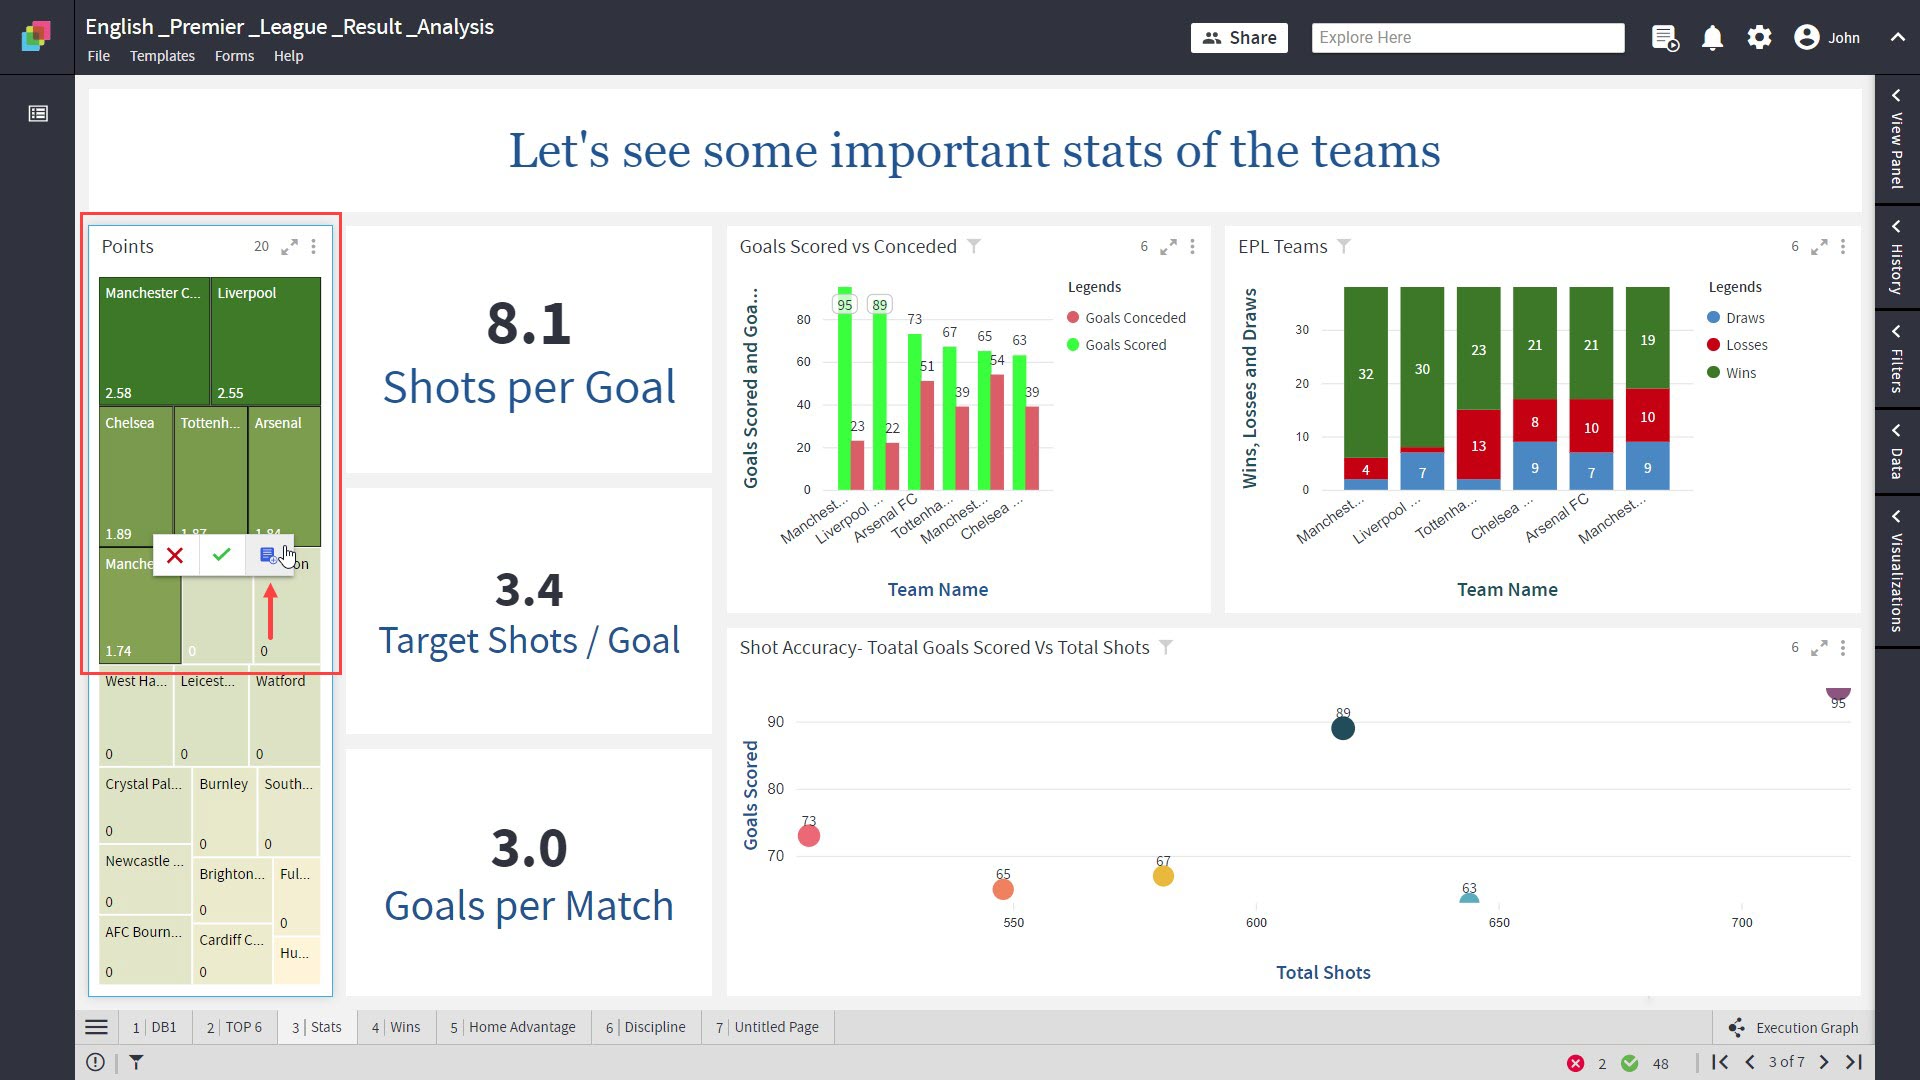
- The newly created Story Point is shown in the Story Panel.
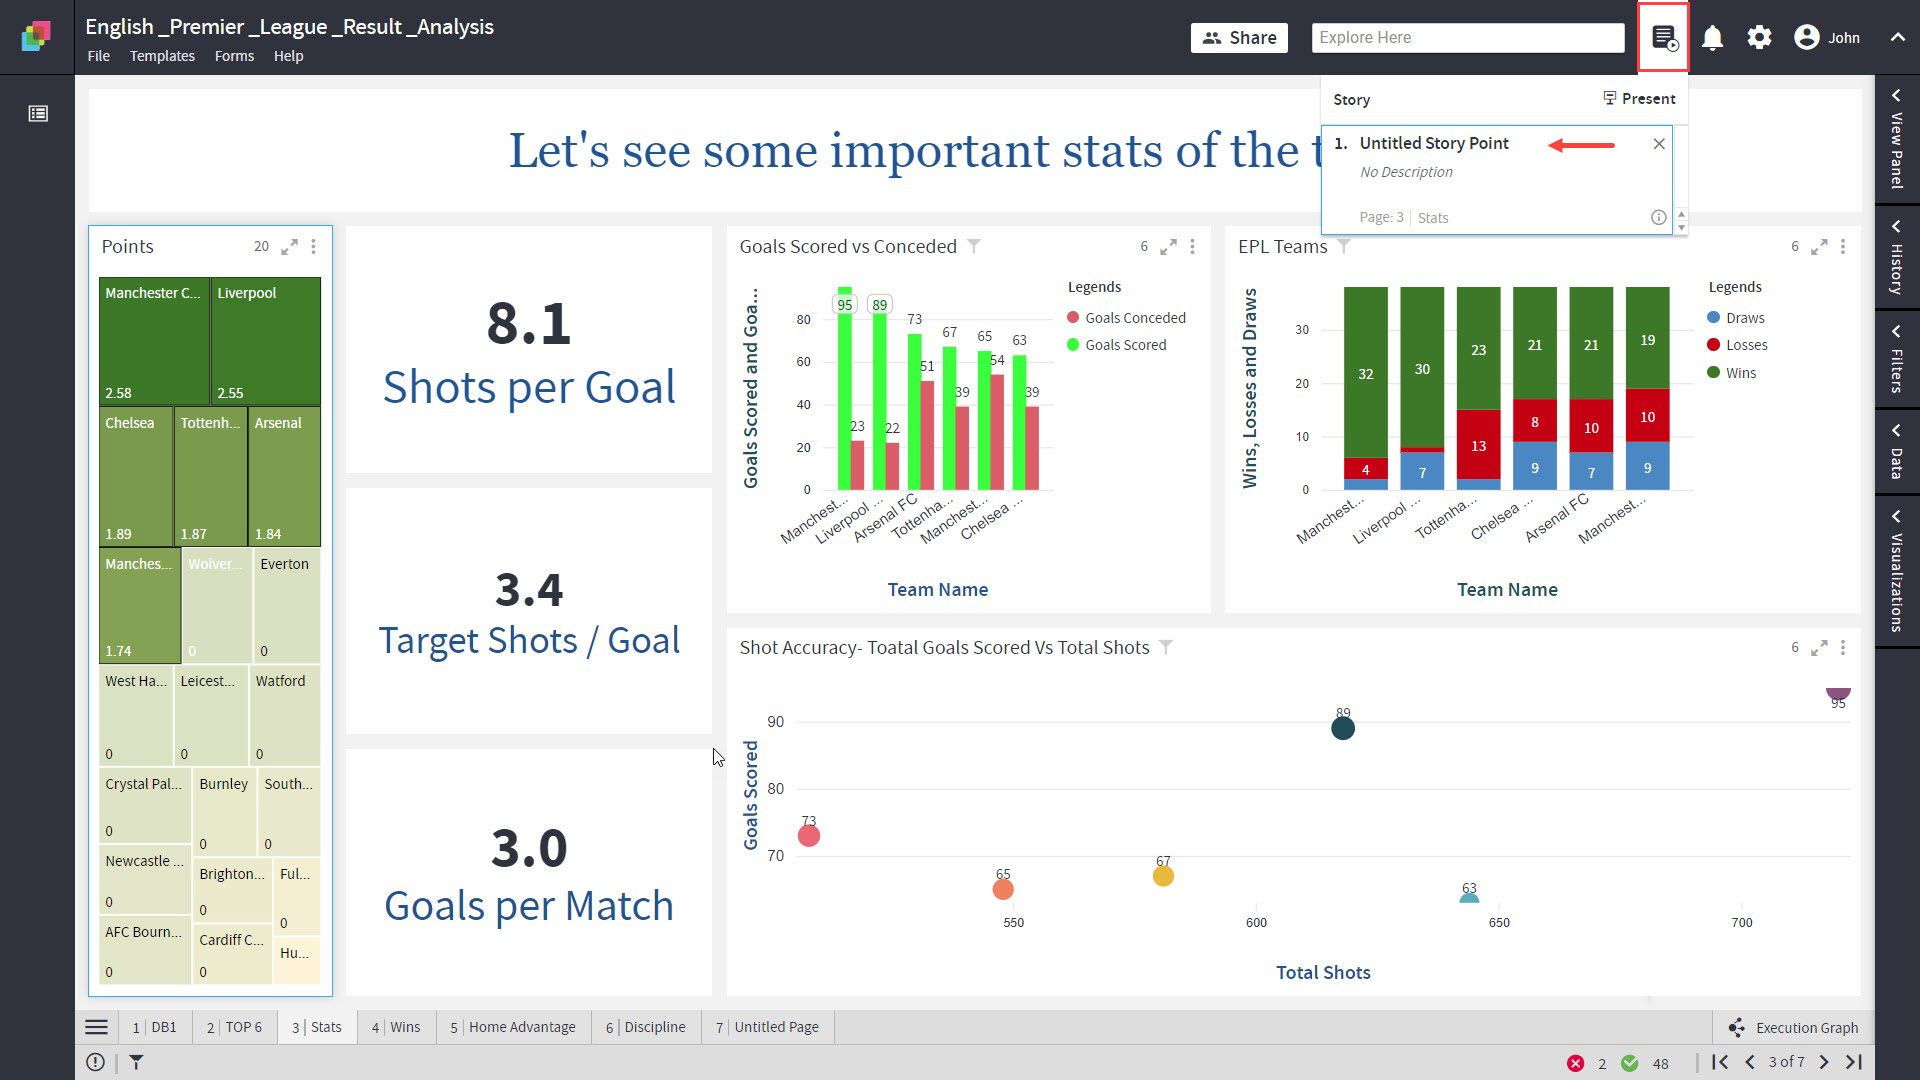
Note: Click on the  icon to access Story Panel.
Page without Selection
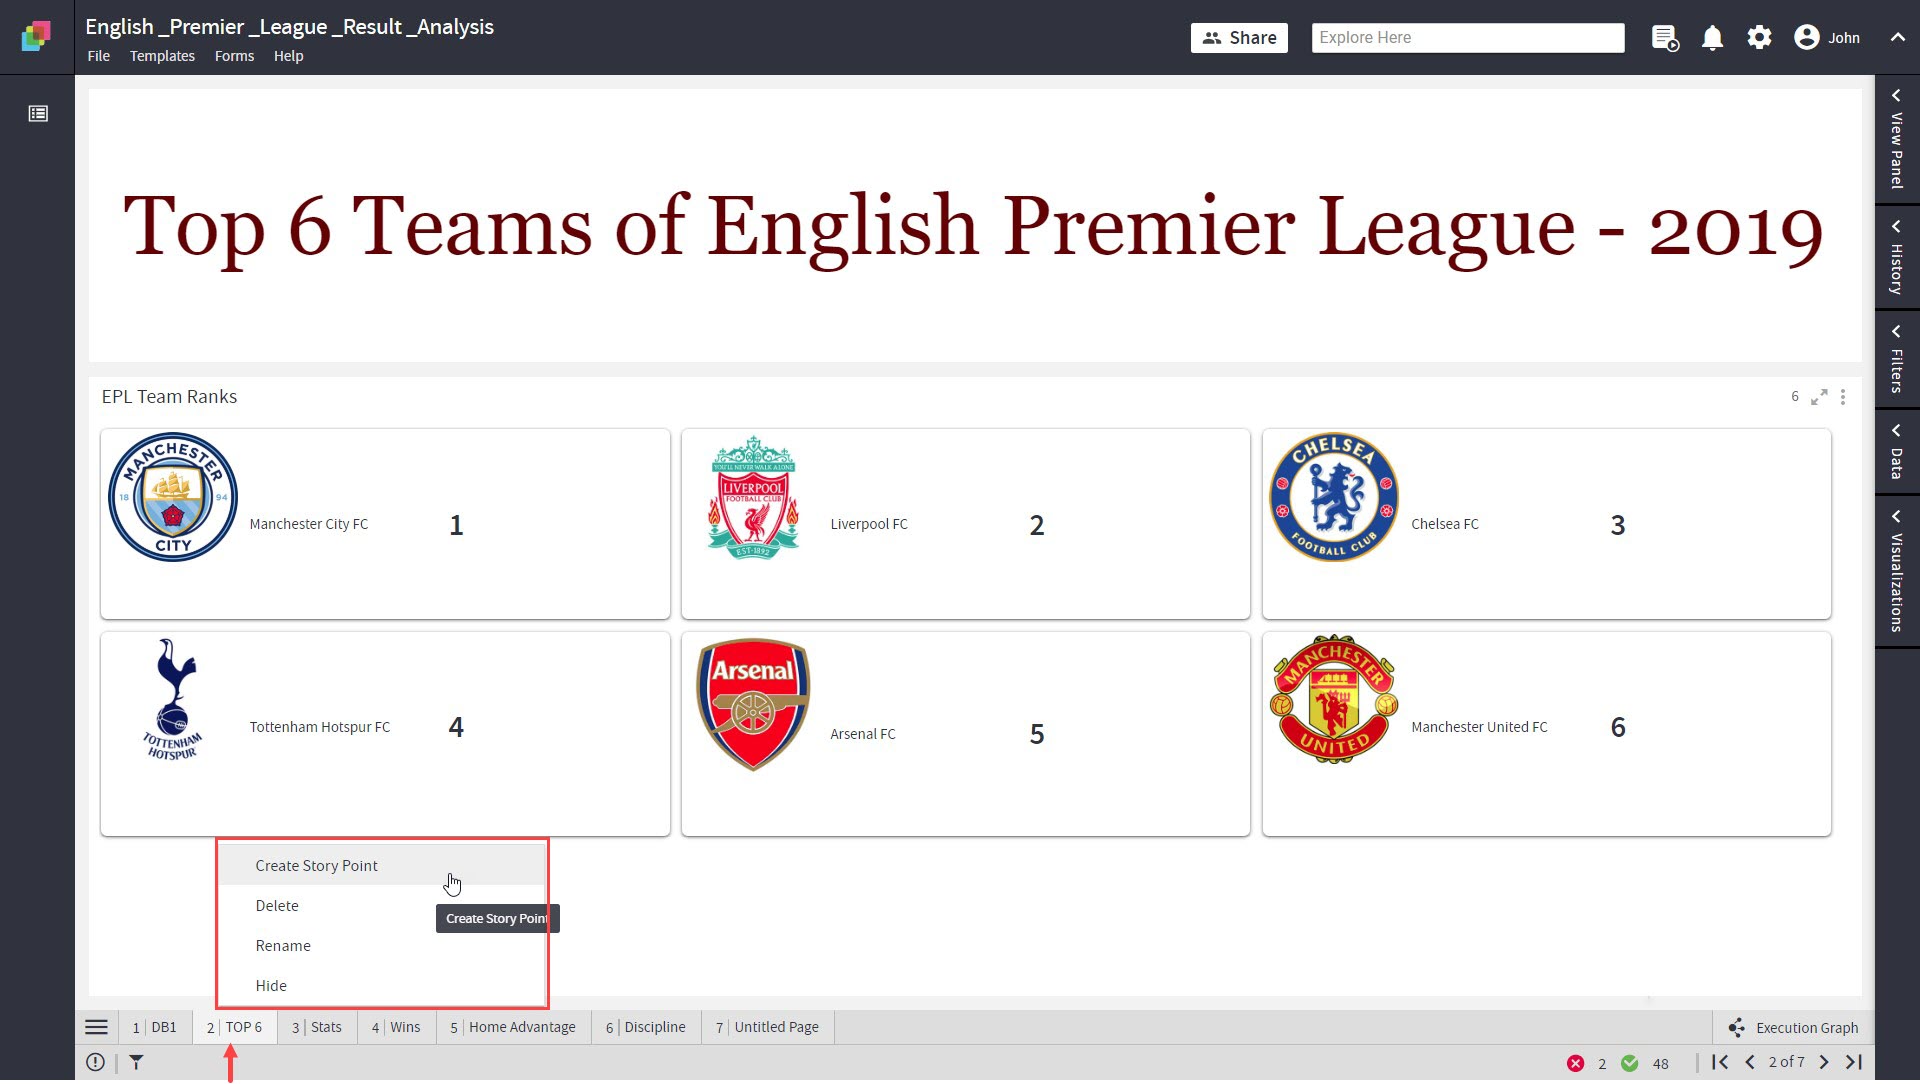
- Right-click on the tab.
- Click on the ‘Create Story Point’ option. The Story Point will memorize the page without selection.
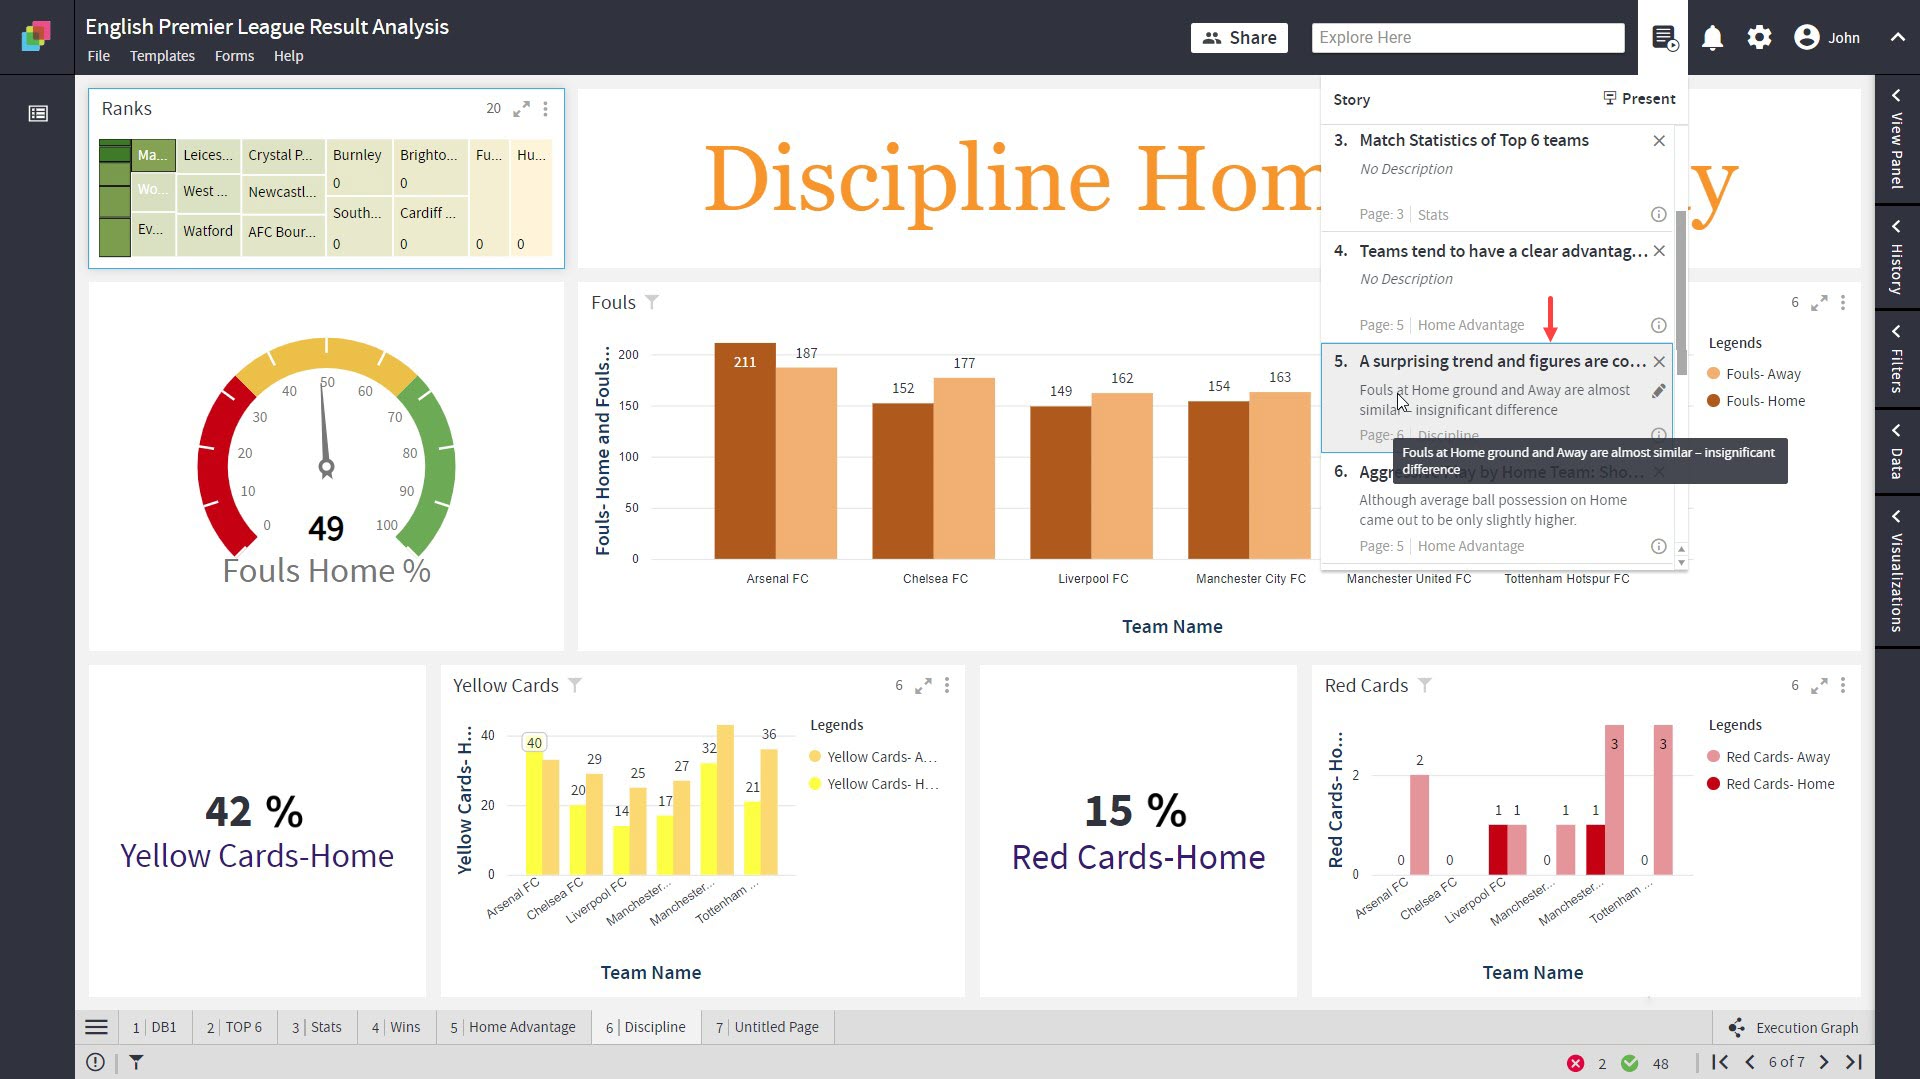
Edit the title and description of a Story Point
- Open the Story Panel, click on the
 icon and type in the new title and description.
 - Click outside the text area to save the changes.
Reorder Story Points
- Drag and drop a Story Point in the Story Panel to reorder them.
| Note: If you create a template for your Exploration, the created Story will be saved with the template. |
To learn more, refer to section- Templates
Delete a Story Point
- Click on the
 icon in the Story Panel to delete the Story Point.
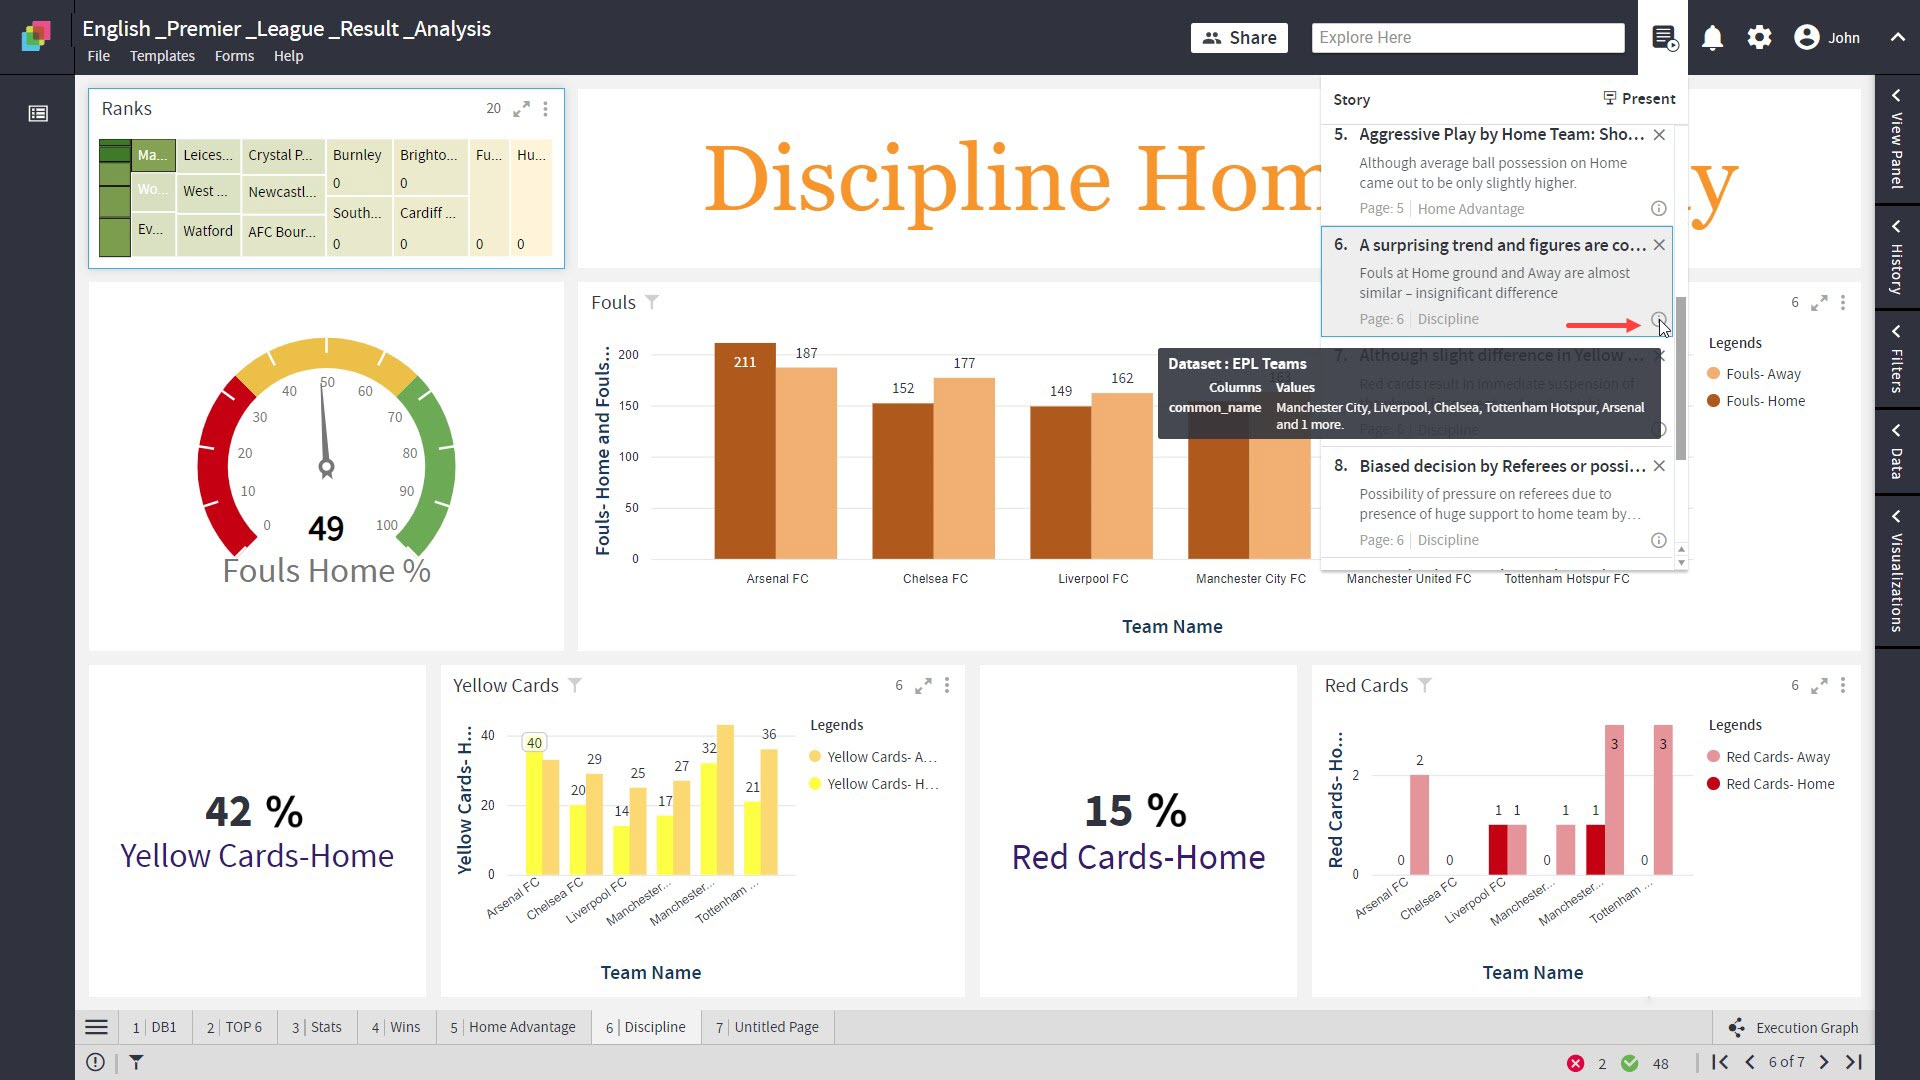
Details of a Story Point
In the Story Panel, you can see details of the Story Point such as Title, Description, Page Number, and Page Name.
- Click on the
 icon to view the following details about a Story Point:
 - Datasets on which selection was done
- Columns which were selected from these Datasets
- Values which were selected from these columns
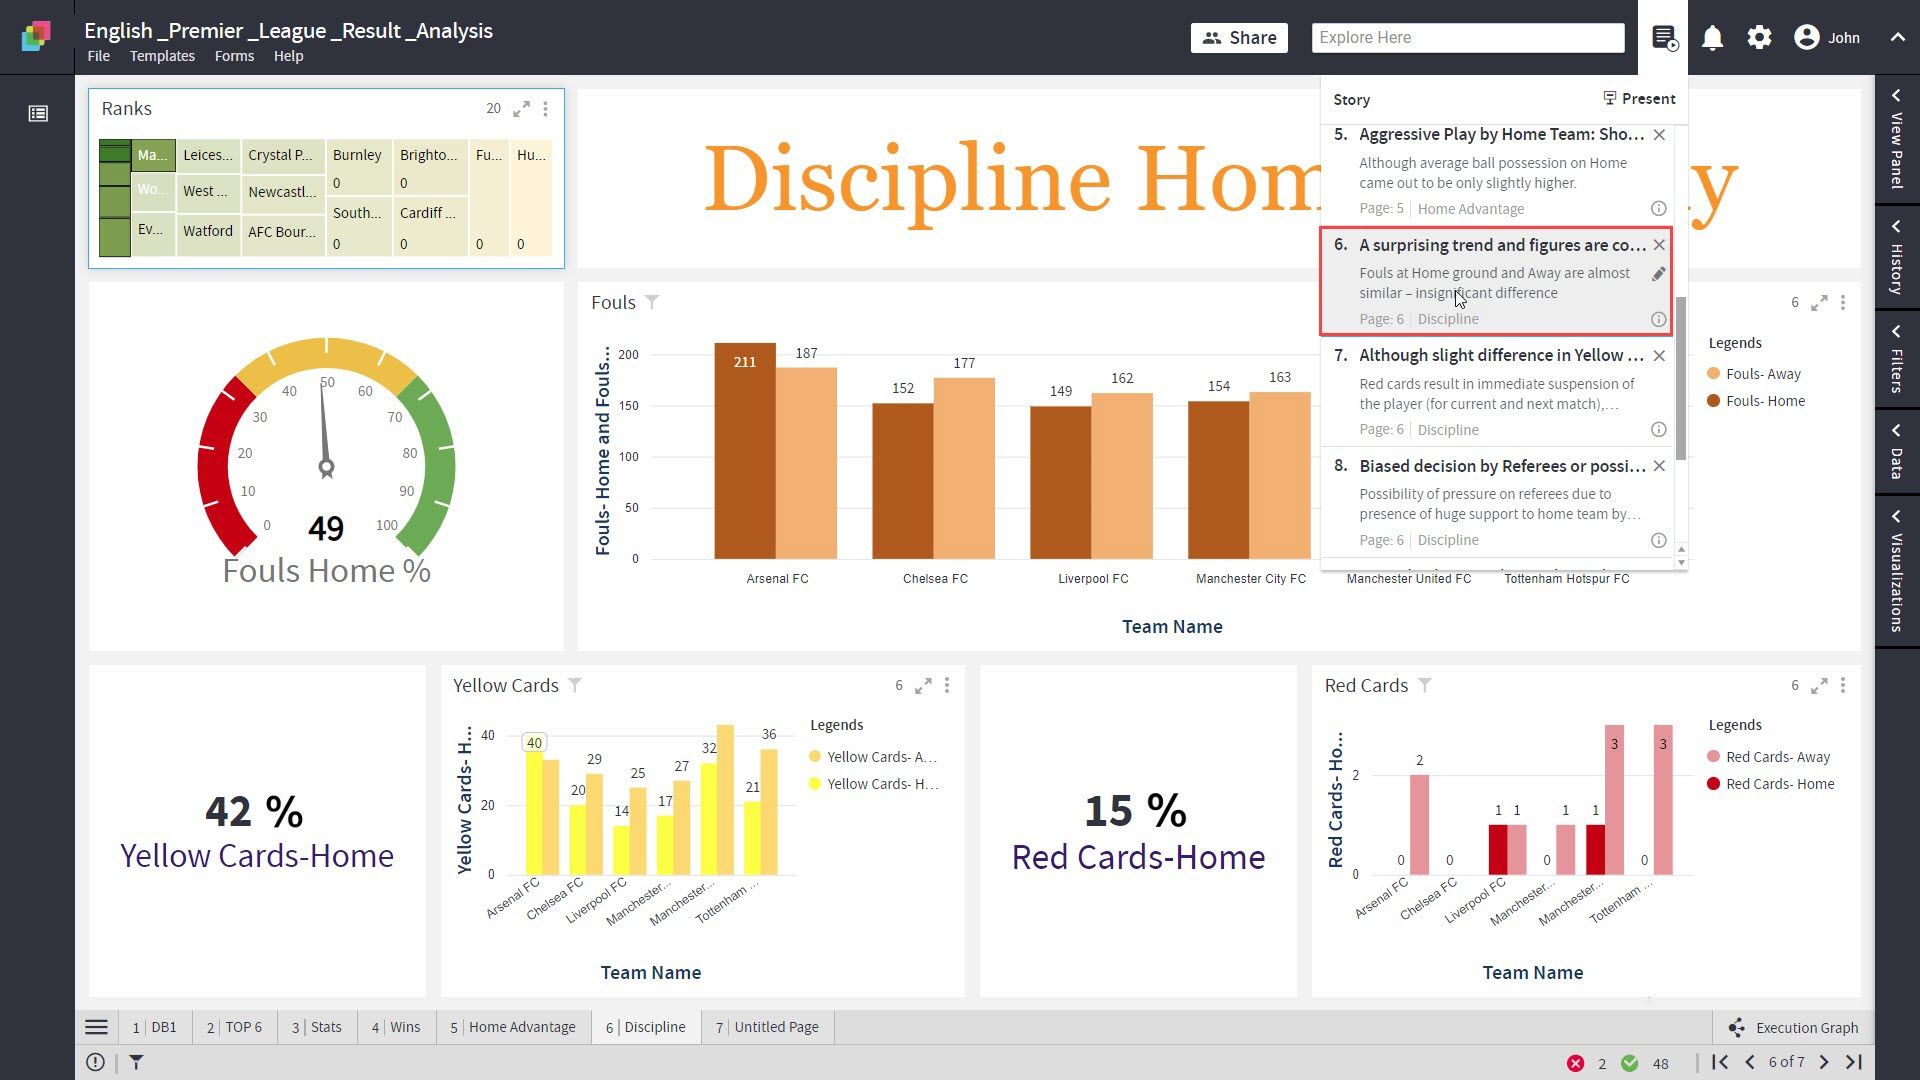
Navigate to a Specific Story Point
- In the Story Panel, click on a Story Point.
- You will be navigated to the page associated with the chosen Story Point and corresponding selections will be shown.
Present a Story
- Click on the
 icon to open the Story Panel.
 - Click on
 to start the presentation.
 - The Story presentation starts with the first Story Point.
The presentation toolbar is shown at the right bottom of the window. There are controls to navigate back and forth through the Story Points.
| Note: The presentation toolbar disappears when the mouse pointer moves away. To bring it back, hover the mouse pointer at the bottom right corner of the window. |
Present Story Points in Order
- Navigate to Left/Right Story Points by clicking on the
 and
and  icons on the presentation toolbar. You can also use Right/Left arrow keys to do the same.
 - To navigate to the First/Last Story Points click on the
 and
and  icon, respectively.
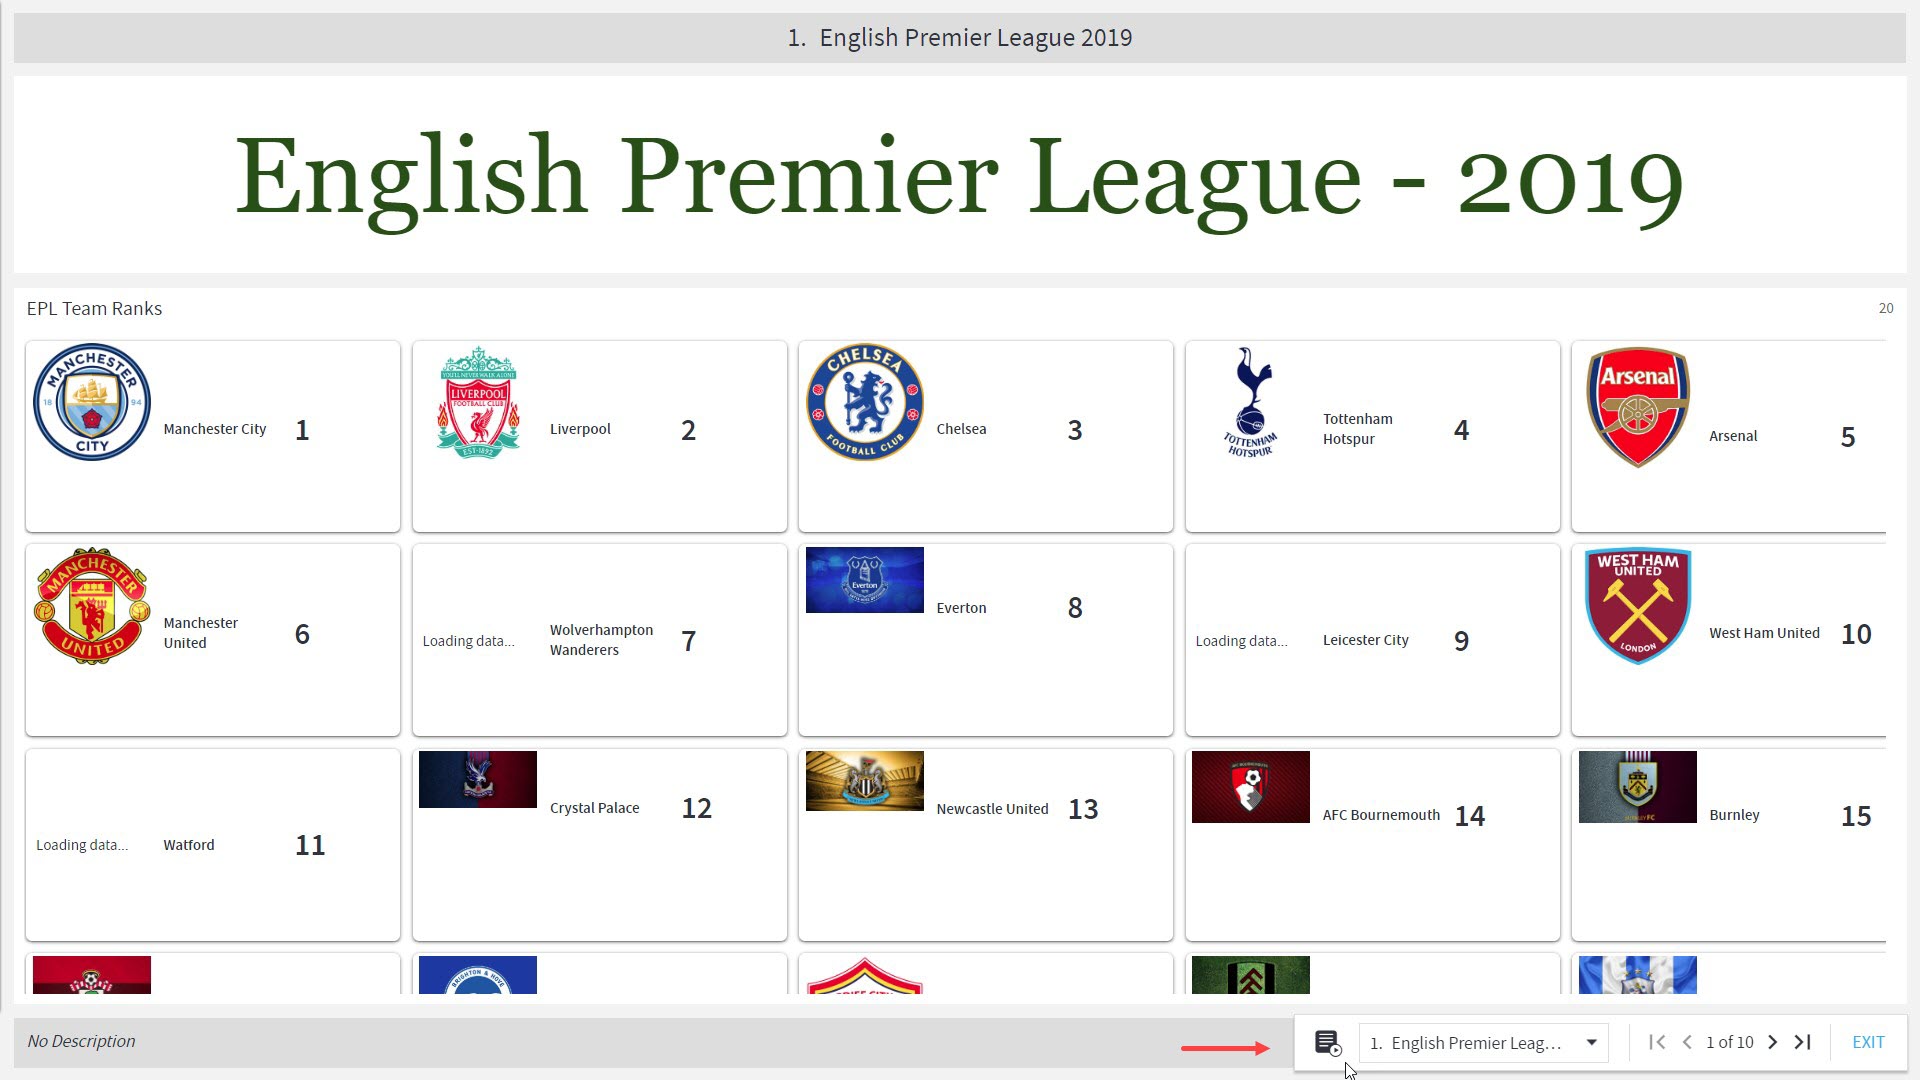
Present a Specific Story Point
- On the presentation toolbar, click on the
 icon.
icon. - Click on a specific Story Point from the drop-down.
Close the Presentation
- Click on
 to stop presenting.
| Note: You can press the Esc key to get the option to stop presenting. Press the Esc key again to exit the presentation view. |

| Note: Story Points of hidden pages are not presented. |
Export a Story
You can export a Story as a PDF. Each Story Point will be shown on a separate page in the PDF. The Story Points will continue to have the same contents/effects in the PDF as created originally.
To learn more, refer to section- Create Reports
FAQ
- Can I create multiple Story Points from a single page?
Yes, you can create multiple Story Points. - Why are some Story Points disabled?
Story Points of the hidden pages are disabled. - Can I delete a disabled Story Point?
Yes, you can delete the Story Point even if it is disabled. - Can I see all other information for a disabled Story Point?
Yes, you can. You can edit the title and description. - How to delete a Story?
To delete a Story, you need to delete all the Story Points.